
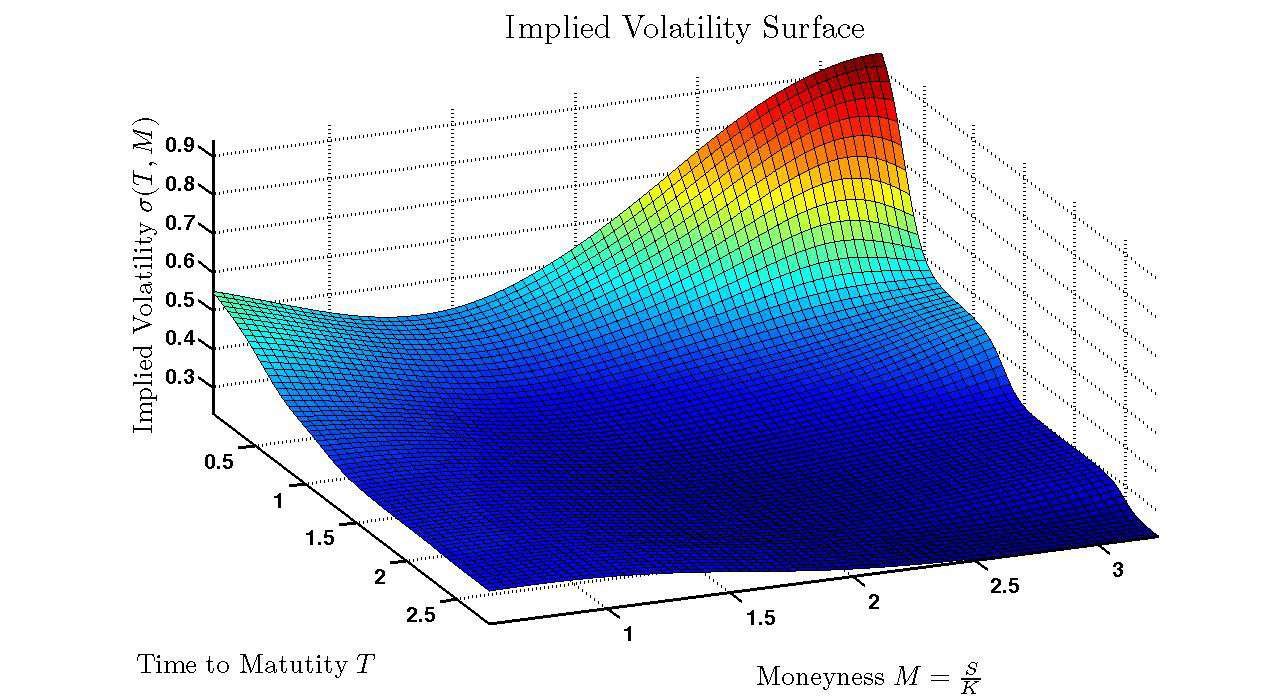
Volatility surface is a three-dimensional plot that shows the implied volatility of a financial asset, such as an option or a future, against its strike price and time to expiration. It is a key tool used by options traders and market makers to analyze market conditions and make informed decisions about pricing and trading options.
• Implied volatility is the estimated volatility of an underlying asset that is implied by the price of its options. It is calculated using an options pricing model, such as the Black-Scholes model, which considers various factors, including the current price of the underlying asset, the option’s strike price, the time to expiration, and interest rates. The implied volatility is then used to price options.
• Volatility surface, therefore, shows the implied volatility of a financial asset for a range of strike prices and time to expiration. It provides a graphical representation of the market’s perception of the asset’s future volatility over time. The surface can be used to identify patterns and trends in the market, such as changes in volatility levels or shifts in the skewness or curvature of the volatility surface.
• Traders and market makers use the volatility surface to price options and manage risk. By analyzing the surface, they can determine the fair value of options and identify mispricing that can be exploited. They can also adjust their trading strategies in response to changes in market conditions, such as changes in implied volatility levels or shifts in the shape of the volatility surface.
In short, volatility surface is a powerful tool that provides valuable insights into market conditions and helps traders make informed decisions about pricing and trading options.
How to Calculate Volatility Surface
Calculating the surface requires a combination of market data, options pricing models, and mathematical techniques. Here is a general overview of the steps involved in calculating a volatility surface:
Collect market data: To calculate the surface, you need data on the prices and implied volatilities of options for a given underlying asset. This data can be obtained from options exchanges, financial data providers, or through the use of proprietary data sources.
Choose an options pricing model: There are several options pricing models available, including the Black-Scholes model, the binomial model, and the Monte Carlo simulation model. Choose a model that is appropriate for the underlying asset and the market conditions.
Estimate implied volatility: Once you have the market data and pricing model, use the model to estimate the implied volatility for each option. This involves inputting the market data, such as the current price of the underlying asset, the option’s strike price, the time to expiration, and interest rates, into the model to calculate the option’s theoretical value. The implied volatility is then estimated by finding the volatility value that makes the theoretical value of the option match its market price.
Construct the surface: Once you have estimated the implied volatility for each option, you can construct the volatility surface by plotting the implied volatility against the strike price and time to expiration. This can be done using a three-dimensional graph or a contour plot.
Refine the surface: The initial surface may require refinement to account for any discrepancies between the implied volatility and the actual volatility of the underlying asset. This can be done by adjusting the volatility values to account for known market factors, such as changes in interest rates, dividend payments, or market events.
Use the surface: Once you have a reliable surface, you can use it to price options, manage risk, and make informed trading decisions.
One should understand that calculating the surface is a complex process that requires specialized knowledge and expertise in options trading, financial modeling, and mathematical analysis. It is typically performed by experienced traders or quantitative analysts using sophisticated software tools and data sources.
How to Interpret Volatility Surface
Interpreting a surface involves analyzing the graphical representation of implied volatility for different strike prices and time to expiration. Here are some key factors to consider when interpreting the surface:
Overall shape: The overall shape of the surface can reveal information about the market’s perception of the underlying asset’s future volatility. For example, a flat surface indicates that the market expects the same level of volatility regardless of the strike price or time to expiration, while a steeply sloping surface indicates that the market expects higher volatility for options with longer time to expiration or further out-of-the-money options.
Skewness: The skewness of the volatility surface can indicate whether the market perceives a greater likelihood of large price movements in one direction or the other. A negatively skewed surface indicates that the market expects a greater likelihood of large downward price movements, while a positively skewed surface indicates that the market expects a greater likelihood of large upward price movements.
Smoothing: In some cases, a volatility surface may be smoothed to remove noise or fluctuations in the implied volatility data. Smoothing can make it easier to identify underlying trends and patterns in the data.
Outliers: Outliers or gaps in the data can indicate potential mispricing or anomalies in the market. Traders and market makers may seek to exploit these opportunities by buying or selling options to profit from the mispricing.
Changes over time: Over time, the shape of the surface may change due to changes in market conditions, such as changes in interest rates, economic indicators, or political events. Traders and market makers should monitor the volatility surface for changes and adjust their strategies accordingly.
One should realize that interpreting a surface requires a thorough understanding of options pricing and market conditions. Traders and market makers should use the volatility surface as one tool among many to make informed decisions about pricing and trading options.
Read More: