
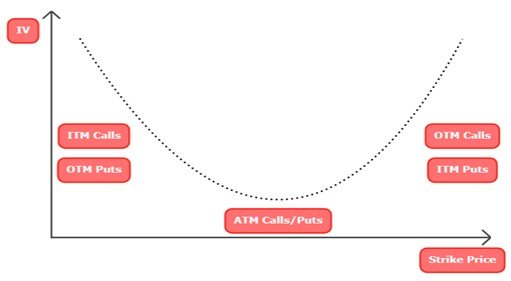
Volatility Skew is simply the comparison of volatility between ATM, ITM and OTM options of a particular contract. Pictorially, it can be represented as below:
As can be seen above, ATM options trade at least volatility compared to OTM options. Generally, in options contract volatilities differ across the strike prices and across call and put options. This difference is known as Volatility Skew and presents an opportunity for the informed trader. A plot of the implied volatility of an option with a certain life as a function of its strike price is known as a volatility smile.
For equity options, the volatility smile tends to be downward sloping (figure below). This means that out-of-the-money puts, and in-the-money calls tend to have high implied volatilities whereas out-of-the-money calls and in-the-money puts tend to have low implied volatilities. For foreign currency options, the volatility smile is U-shaped. Both out-of-the-money and in-the-money options have higher implied volatilities than at-the-money options. Often traders also use a volatility term structure. The implied volatility of an option then depends on its life. When volatility smiles and volatility term structures are combined, they produce a volatility surface. This defines implied volatility as a function of both the strike price and the time to maturity.
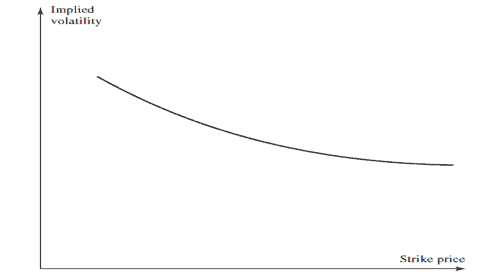
It is interesting to note that the pattern in the above figure for equities has existed only since the stock market crash of October 1987. Prior to October 1987, implied volatilities were much less dependent on strike price. This has led the legendary Mark Rubinstein to suggest that one reason for the equity volatility smile may be ‘‘crashophobia.’’ Traders are concerned about the possibility of another crash similar to October 1987, and they price options accordingly.
Traders allow the implied volatility to depend on time to maturity as well as strike price. Implied volatility tends to be an increasing function of maturity when short-dated volatilities are historically low. This is because there is then an expectation that volatilities will increase. Similarly, volatility tends to be a decreasing function of maturity when short-dated volatilities are historically high. This is because there is then an expectation that volatilities will decrease.
Key Points of Volatility Skew
- When there is an equity market decline, there is normally a larger increase in ATM implied volatility at the near end of volatility surfaces than the far end. Assuming sticky strike, this causes near-dated skew to be larger than far-dated skew. This simply means that volatility shoots up more in near expiry contracts than far expiry contracts.
- Skew tends to rise as ATM implied vols fall as low strike implied vols are ‘sticky’. If there is a sudden decline in equity markets, it is reasonable to assume realized volatility will jump to a level in line with the peak of realized volatility. Therefore, low-strike, near-dated implied vols should be relatively constant (as they should trade near the all-time highs of realized volatility). If a low-strike implied is constant, the difference between a low-strike implied and ATM implied increases as ATM implied vols falls. This means near-dated skew should rise if near-dated ATM implied vols decline.
- Skew for equity options is normally inverted. This simply means that volatility of OTM options (put side) is significantly greater than ATM options. Unless there is a high likelihood of a significant jump upwards (e.g., if there were a potential takeover event), equities normally have negative skew (low strike implied greater than high strike implied). There are many possible explanations for this, some of which are listed below.
- Big jumps in spot tend to be down, rather than up. If there is a sharp jump in the stock price, it is normally on the downside as it is more common for an unexpectedly bad event to occur (bankruptcy, war, natural calamity, terrorist attack, accident, loss, or death of key personnel, etc.) than an unexpectedly good event to occur (positive drivers are normally planned for).
- Volatility is a measure of risk and leverage (hence risk) increases as equities decline. If we assume no change in the number of shares in issue or amount of debt, then as a company’s stock price declines its leverage (debt/equity) increases. Both leverage and volatility are a measure of risk and, hence, they are correlated, with volatility rising as equities fall.
- Demand for protection and call overwriting. Typically, investors are interested in buying puts for protection, rather than selling them. This lifts low strike implied vols. Additionally, some investors like to call overwrite their positions, which weighs on higher strike implied vols.
Trading Volatility Skews:
- Volatility Skews can largely be traded through calendar spreads (horizontal spreads) and vertical spreads. Calendar spreads are basically trading option contracts of the same underlying across different expiries. Vertical spreads are creating option structures in same expiry but different strikes i.e., creating a debit or credit spread.
- The idea of a calendar spread structure is to take advantage of expected differences in volatility and time decay, while minimizing the impact of movements in the underlying security. For example, if vols are higher due to an upcoming earning release or any scheduled corporate action then a trader can sell those near expiry high vols and buy the same strike on a far dated expiry. Such kind of structures are initiated by traders who are not expecting moves greater than 2-sigma. If the underlying moves significantly more than vols pricing, then a trader can incur losses due to interplay of other option greeks. This structure is more complex than vertical options spread.
- Traders who prefer simpler structures and putting up of less upfront margin look for initiating vertical spread to implement skew trades. An example of this, creating a bull spread structure instead of a bull call structure to benefit from higher vols when looking for bullish trades.
Read More: